The Critical Path – A Tool To Keep The Project On Schedule
Practical Definition
The longest paths of tasks through the project plan with zero float or zero slack.
PMBOK® Guide Definition
Generally, but not always, the sequence of schedule activities that determine the duration of the project. It is the longest path through the project.
Defining the Critical Path
Normally, the critical path defines the overall length of a project. Why is it important to know which path determines the overall project length? It means that if any task along that path, known as a critical task or critical activity, slips by even one day, the project will suffer a day-for-day slip minimum. The project may slip more depending on the impact of the slip on resources or other factors, but at minimum, the slippage will be at least the amount of the task’s delay.
In some cases, a small slip won’t impact the overall project’s success, but if time is the driving constraint (see Triple Constraint and Beyond), any slip must be managed carefully.
What is Slack or Float?
Slack and float are the same. We have two different terms for slack and float because of project management’s history. Modern project management began in the 1950s. Of course, project management has been around for a very long time. Certainly, the Egyptians used some form of project management to build the pyramids and other massive structures. In fact, they employed project managers, although they usually held the title of slave masters. Their tools of the trade were not schedules and budgets, but whips, chains and free labor. We are not permitted to use those tools anymore and labor costs money these days, therefore, we must resort to project plans, due dates, and funding constraints.
In the 1950s, the US Navy developed the Polaris Missile and submarine (for an interesting account of that project as it relates to Risk Management, read Polaris: Lessons in Risk Management). At the time, they had no formal process in which to manage the project. During that time, they defined PERT – Project Evaluation and Review Technique, a methodology we still use today. They defined a term called slack which represented a period of time a task might be delayed without impacting the project schedule or its successor task (they couldn’t use the term float because that has a different meaning when it comes to the Navy).
At the same time, private industry developed a methodology called CPM – Critical Path Method – with a similar concept called float. Both consider the amount of time an activity may be delayed without impacting the project schedule or its successor task.
On the critical path, there is no slack or float. No task or activity can be delayed without impacting its immediate successors or the project schedule.
See What Is Slack? What Is Float? Is There A Difference? for a more complete definition and the use of slack or float in managing projects.
How to Determine the Critical Path
Determining the critical path is relatively simple and a necessary evil for those wishing to pass the Project Management Professional (PMP®) exam. We simply create a network diagram of the project, traverse each path adding the durations of each task for the leg. Whichever leg of the schedule has the greatest duration becomes the critical path. Since we start at the beginning of the network diagram and travel toward the last task, we call this the forward pass.
We conduct a similar process backwards through the diagram, called the back pass, which gives us values used to determine the float times for each activity.
Using the diagram below, lets understand what this means.
The following notation represents an activity (task and activity are the same and used interchangeably, although the PMBOK® Guide has migrated to the use of activity exclusively. Microsoft Project still uses the term task).
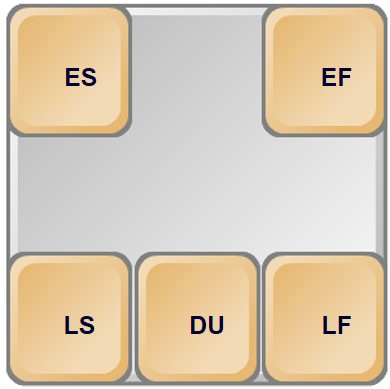
- ES = Early Start – the earliest the task can start
- EF = Early Finish – the earliest the task can finish, calculated from the ES plus the duration
- LS = Late Start – the latest the task can start without impacting the project schedule
- DU = Duration – planned value
- LF = Late Finish – the latest a task can finish without impacting the project schedule
The Forward Pass – Determining the Critical Path
To determine the critical path, the total float and free float of the network diagram, we conduct a forward and backward pass through the diagram traversing each leg of the network. The forward pass calculates the Early Start (ES) and Early Finish (EF) values. The backward pass calculates the Late Start (LS) and Late Finish (LF) values. The forward pass determines the critical path, the longest path through the network diagram. The backward pass provides the information needed to determine the free and total float for each activity.
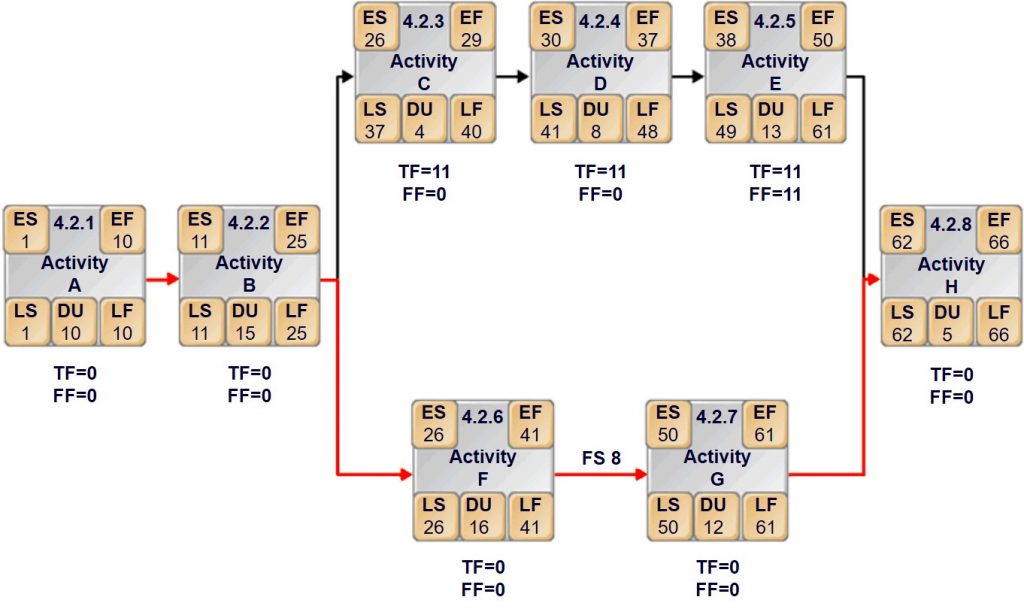
We start the forward pass beginning with the first task, Activity A in the diagram. We start with 1 for the value of Early Start (ES) since it starts on the first day or Day 1. We determine the earliest Activity A can finish – Early Finish (EF) by adding the Duration (DU) to ES and subtracting 1. Think about that! If a task’s duration is 5 days, it starts on Day 1 and ends on Day 5. If we simply add the duration to the Early Start (ES) then EF would be 6, which is not correct (prove it to yourself by counting on your fingers … 1, 2, 3, 4, 5 fingers). Using the diagram below, EF for Activity A is 10 because 1 (ES) plus 10 (DU) minus 1 equals 10 (EF).
Activity B begins the next day or Day 11, so we add 1 to EF of Activity A to determine the ES of Activity B, in this case, 11. To determine Activity B’s EF, we add its Duration and subtract 1 which is 25. We add 1 to the EF of Activity B to determine the ES of Activity C and Activity F since we see a branch in the network diagram. If there were three branches, we would use the same value for all three activities branching from Activity B. We repeat this process for each activity in the network diagram.
Early Finish (EF) = Early Start (ES) + Duration (DU) – 1
Successor Task Early Start (ESs) = Predecessor Early Finish (EFp) + 1 + Lag
Caution: Note on the bottom branch of the diagram a designation FS 8 between Activity F and Activity G. This represents a Finish-to-Start relationship (FS) between the two tasks with a lag of 8 days. We must add the lag value of 8 days to the EF to generate an accurate ES for the successor task. See Four Logical Relationships of Project Management: What They Are and How To Use Them and Fine-Tuning Relationships with Lead and Lag.
A Common Mistake
Since we add one to EF going forward, we must remember to subtract the 1 as we do the backward pass. We’ll expand on this below.
Note: Activity H has two predecessors: Activity E & G. Both may determine its ES. During the forward pass and following the top path first, Activity E’s EF is calculated as 51, therefore, the ES value of Activity H would initially be 52. The value is replaced by Activity G’s EF + 1 when computing through the bottom path because it is greater, thus extending the project’s overall end date. During the forward path, greater values replace lesser values when an activity has more than one predecessor. So we see Activity H’s ES and EF are 62 and 66 respectively. Thus, the project’s shortest duration is 66 days. The bottom path determined the project’s length and is identified as the critical path (and was highlighted in red for illustrative purposes only).
The critical path for the the example is activities A, B, F, G, and H. If writing the critical path or looking for the answer on the PMP® test, it would be designated A, B, F, G, H.
The Backward Pass – Determining the Float of Each Task
Once we have finished the forward pass, we can begin the backward pass. The backward pass generates the numbers we use as float values for each task – the amount of time a task can be delayed without delaying a successor task or the project end date.
To conduct the backward pass, we start by copying the EF of the last task, in this case, Activity H, into the LF (late finish) of the last task. Thus, by definition, the EF and LF of the last task of the project are equal. This only makes sense because, if the last task were to slip, the project end date would also slip. Therefore, the early finish and the late finish of the last activity must be equal.
Next, we subtract the DU of the last task from the LF to derive the LS of the last task and add 1 (remember, we subtracted one in the forward pass. In the backward pass, we need to add one. Prove it to yourself by using your fingers). Again, the ES and LS of the last task should be the same, by definition. We continue the backward pass by subtracting 1 from the LS of the task (Activity H at this point) to determine the LF of any predecessor task (Activity E and G). Of course, if any lag time is designated, we must subtract it from the value first as noted in the caution above – a lag exists between Activity F and G above, therefore, we must subtract 8 from Activity G’s LS. We continue this process for each predecessor until we reach the first task in the project.
Late Start (LS) = Late Finish (LF) – Duration + 1
Predecessor Late Finish (LFp) = Successor Late Start (LSs) – 1 – Lag
In the event a task has two successors, as Activity B does in the above diagram, the lowest value is copied into its LF position. If we have done all the subtraction operations correctly, when we reach the LS of the first task, it should be 1 for at least one of the paths in the diagram. If you do this exercise on the network diagram above following the top path first, you’ll note the value of LS for the first activity will be 11. Once you complete the backward pass of the bottom path, LS of Activity A will be 1.
Computing Slack and Float For the Diagram
By definition, activities on the critical path, known as critical activities, should have no float or float should equal 0. Since we’ve determined the bottom path above is the critical path, we can simply assign 0 to both the Total Float (TF) and Free Float (FF) of each activity along the path. We will prove this mathematically correct later.
To determine the Total Float for the non-critical activities, those activities appearing on the non-critical paths, we subtract the ES from the LS of the task. For example, Activity C’s ES is 25 and LS is 36. Subtracting 25 from 36, we calculate the Total Float for Activity C to be 11. Assuming this represents 11 days, the answer tells us we can let Activity C slip by 11 days without impacting the project end date. If Activity C were to slip by 12 days instead, the project end date would also slip.
Calculating Total Float
Calculating Total Float for each activity along the top path of this diagram, we soon realize Total Float for each task is the same at 11 days for each activity on the non-critical path. Let’s understand what this means. Often, a project schedule will have multiple non-critical paths. Each path has a different Total Float value.
At the start of the project, Activities C, D, and E can slip a maximum of 11 days total without impacting the project end date. If Activity C were to slip 3 days or take 3 days longer than originally planned, then Total Float would decrease to only 8 days remaining for Activities D and E. Furthermore, if Activity D slipped an additional 5 days, Total Float would adjust to 3 days meaning Activity E only has 3 days of leeway without impacting the project end date. So you can see, Total Float changes as the project progresses and activities slip or take longer to complete than originally planned.
Proving mathematically Total Float on the critical path is 0, we simply subtract the ES of a critical task from its LS and we calculate 0 because ES equals LS for critical tasks.
The formula for calculating Total Float:
Total Float = Late Start (LS) – Early Start (ES)
Calculating Free Float
Free Float is the amount of time an activity can slip without impacting the ES of a successor task. To calculate Free Float, we subtract the Early Finish (EF) of the predecessor task from the Early Start (ES) of the successor task minus 1 minus any specified lag time. The formula looks like this:
Free Float = Successor Task Early Start (ESs) – Predecessor Early Finish (EFp) – 1 – Lag
where the sub-scripted S is the successor task and the sub-scripted P is the predecessor task. The only activity that has Free Float above is Activity E. Initially, it can slip 11 days without impacting Activity H, its successor. As the project progresses, Free Float can change just as Total Float changes. By performing the Free Float equation on all the other tasks, it is easily seen Free Float is always zero. In fact, the only place Free Float exists is at the end of a non-critical path.
Once again, prove Free Float is 0 for critical activities by using the formula stated above.
Of Course You Wouldn’t Calculate The Critical Path By Hand In The Real World…
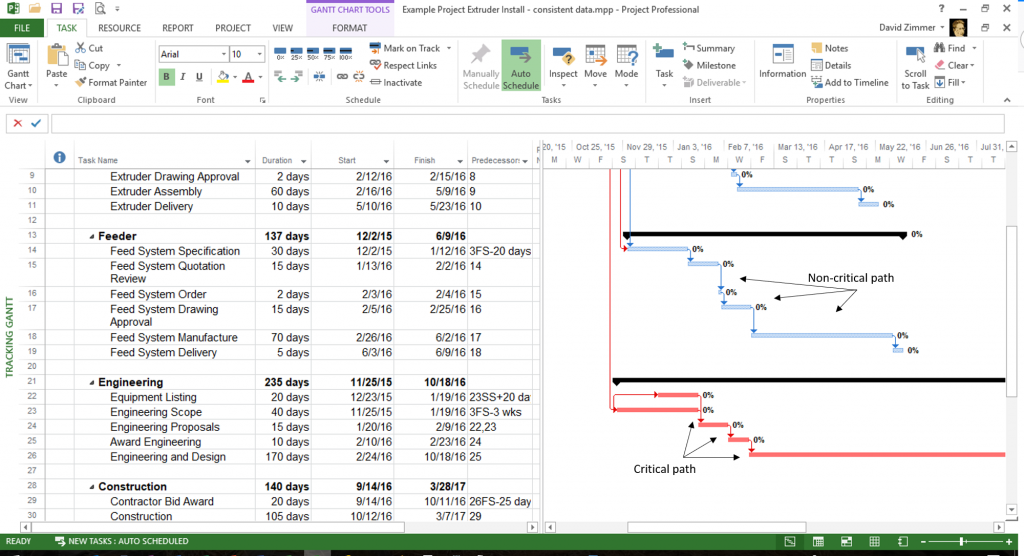
The diagram above only depicts 8 activities. Real project plans typically have 400 to 800 tasks. Determining the critical path by hand would be very time consuming. Fortunately, software programs such as Microsoft Project contain the capability to determine the critical path. Microsoft Project highlights the Gantt bars in red when viewing the Tracking Gantt view. Non-critical tasks are displayed with blue bars, by default.
Understanding how the critical path is determined is important for project managers so they can leverage the slack or float time accordingly to help keep critical tasks on schedule. Leveraging the float time is described in more detail in What is Slack? What is Float? Is There A Difference?
The critical path works in conjunction with the knowledge of the triple constraint discussed in the article Triple Constraint and Beyond.
Conclusion
The critical path is an important tool in the project manager’s toolkit. Understanding its importance and relationship to the project schedule help project managers keep projects on-time. When used in conjunction with the triple constraint (or sextuple constraint as described in the Triple Constraint and Beyond article), project managers can deliver more projects successfully.
PMBOK® Guide is a registered trademark of the Project Management Institute. All materials are copyright © American Eagle Group. All rights reserved worldwide. Linking to posts is permitted. Copying posts is not.